Are you new to Business Central? Perhaps you have moved systems in your role or have a new role (congratulations!) that uses Business Central/ Dynamics.
And it looks nothing like Sage or any of the other systems you have used before.
The terminology is even different!
This was me a Sage through and through Accountant and Finance Manager to all of a sudden a new role and Business Central.
This blog has you do not fear, favor this site get all of the Business Central how to’s and tips to make your work life much easier and impress your colleagues.
This article is going to look at the Chart of Accounts and getting a TB.
(Without the tech jargon)
What does Balance, Balance At Date & Net Change Mean?
The Chart of Accounts and Trial Balance seems a lot more complicated than Sage.
You have so many more filters to use and different balances at the top.
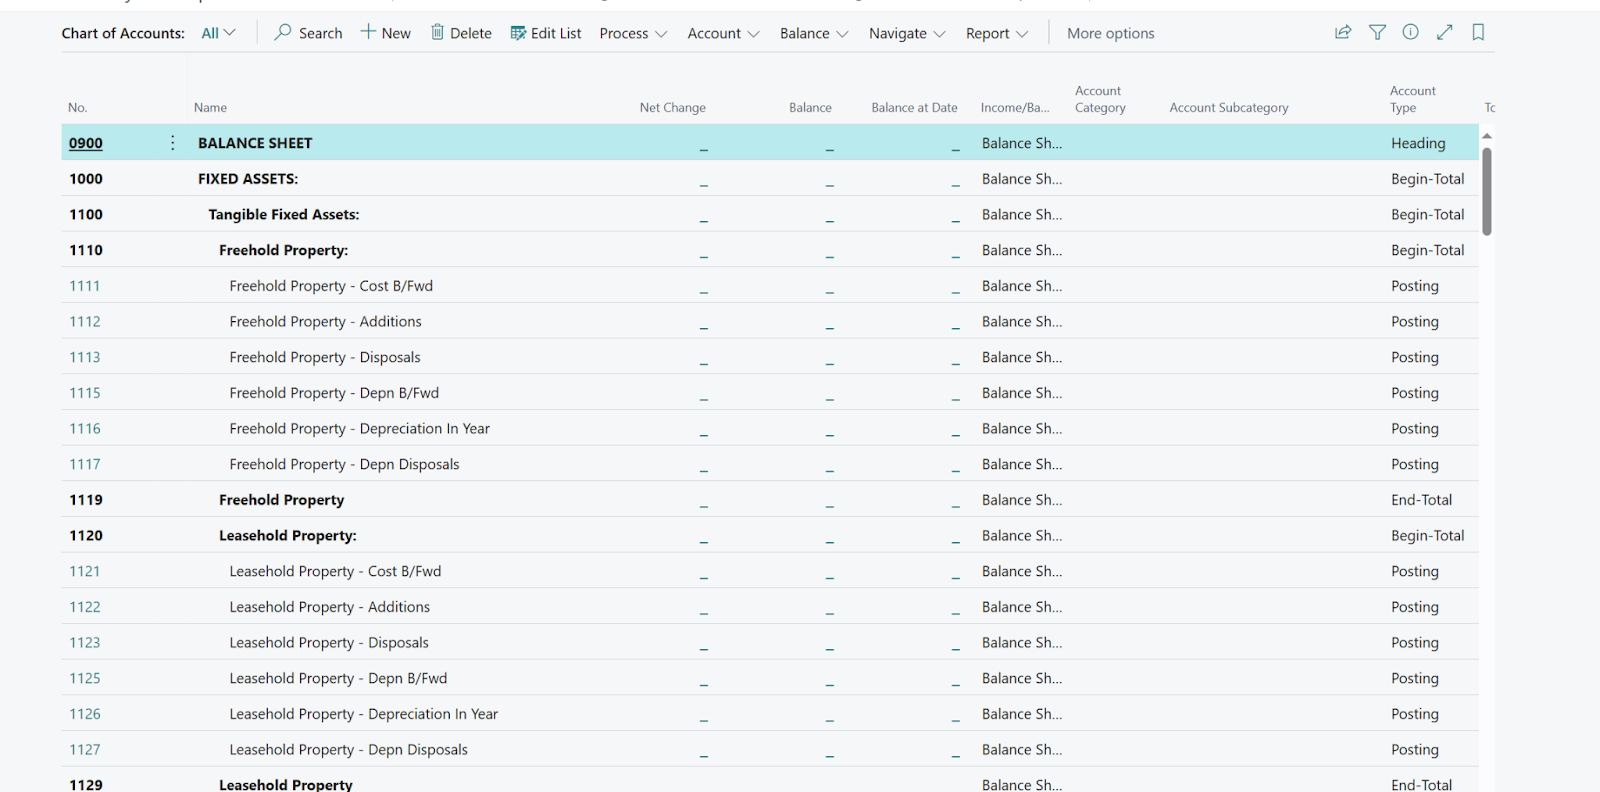
When you open Chart of Accounts in Business Central it looks something like this;
Now a key thing to remember in Business Central is that you can customize your view so not one persons can look the same.
On the plus if you do not like the look of it you can change it.
I will post a blog about how to personalize your view in Business Central and link it below.
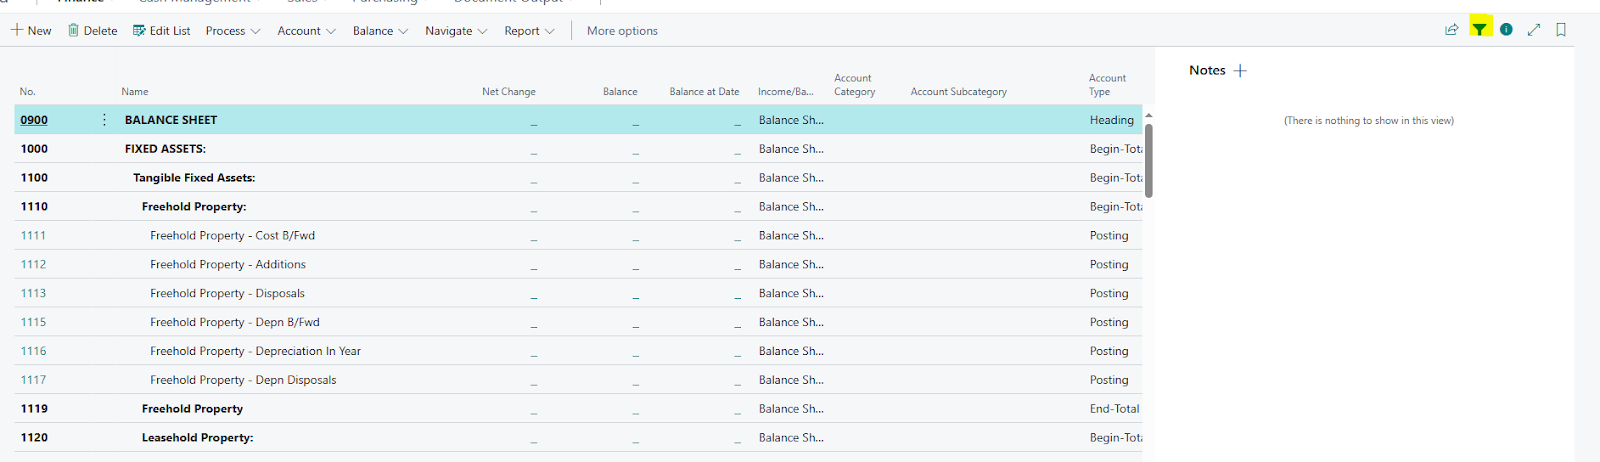
Clicking the filter button at the top right hand corner brings up all the things you can filter on and its alot!
All of the fields.
The main one to look at here is the date filer you want to use this to get the figures for the correct period that you want.

The biggest confusion comes from the what the fields Net Change, Balance and Balance At Date do in Microsoft Dynamics.
Balance
So it is the latest or current balance.
Balance field always shows the sum of all the transactions regardless of what date filter you have set.
Net Change
Net Change is shows the sum of the movement in the date filter range you have inputted.
Balance At Date
This one is key for Finance roles and the field I use the most, this field shows the balance at the end of the date filter you have put in from the start of the financial year.
In other words the balances you would see if you ran a Trail Balance in Sage at whatever month end you choose.
Lets work through a example to make it a little easier;
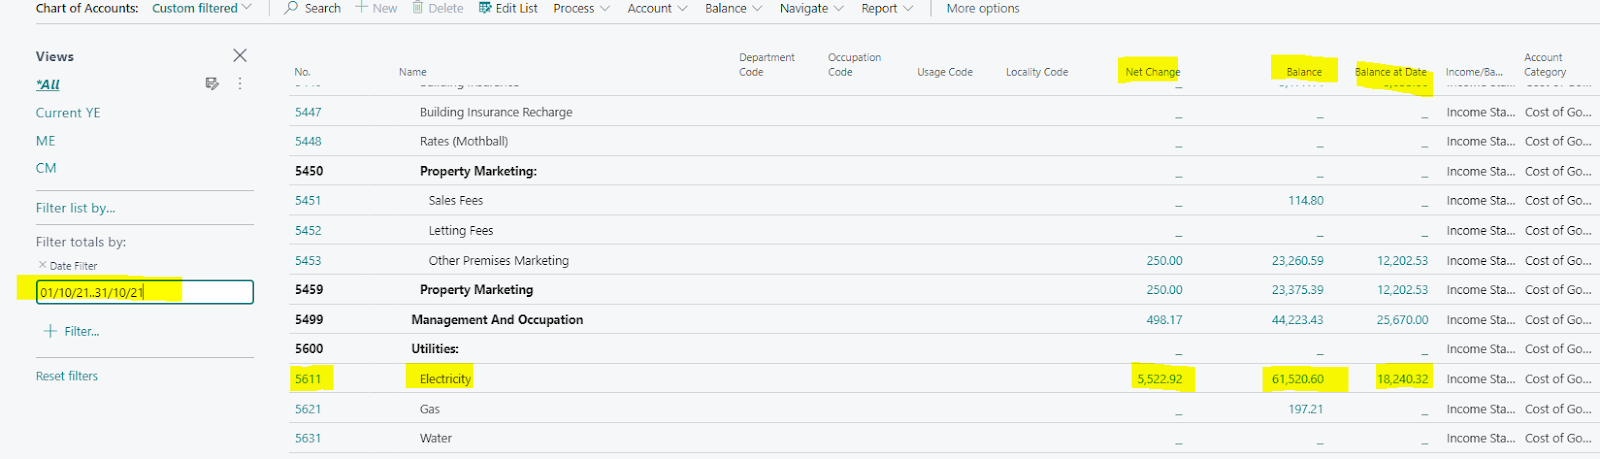
In the above example I have inputted a date range of 01/10/21 to 31/10/21 looking at code 5611 for Electricity.
The net change for the period shows the sum of the transactions during October 2021.
The Balance at date shows the balance as at 31/10/21 from the start of the financial year.
Lets remove the 01/10/21 and just look at 31/10/21.
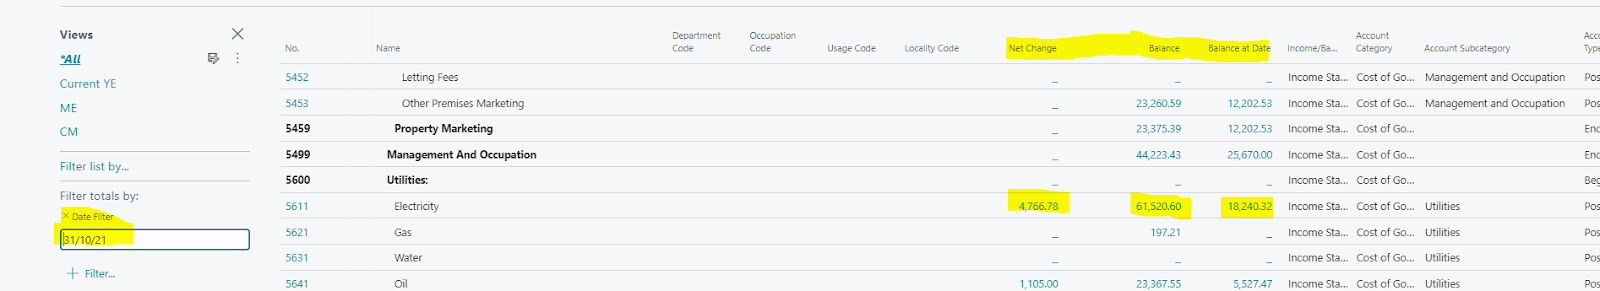
As you can see net change has changed this now shows the sum of the transactions only on 31/10/21.
But Balance and Balance at Date have not changed.
If we change the date to another month say 30/11/21 the Balance at Date alter to the balance form the start of the financial year to 30/11/21.
The net change will move for this date range.
Balance will remain the same as at the current balance.
Lets confirm;

Understanding these three fields is a real game changer for getting to grips with the chart of accounts in Business Central.
Once you understand these its easy to get the financial figures out that you need.
Another quick tip to add to make easier viewing of the chart of accounts in Dynamics if you filter on Balance and enter = <>0
This will remove any G/L accounts that have no balance in cutting down the chart of accounts.

A lot neater and smaller to view and export into Excel!